Georgetown McDonough MBAs Launch HoyAnalytics Club

A group of Evening MBA students at the Georgetown University McDonough School of Business recently launched HoyAnalytics—a student organization focusing on statistics and data analytics. Though the club is is pending official sponsorship by the MBA Program Office, it has drawn a lot of interest in the McDonough School of Business.
According to the McDonough School, HoyAlytics is the first club organized by Evening MBA students. The organization’s board is made up of both full-time and Evening program students, and was created with unifying the two MBA programs in mind.
But the organization’s two main objectives are to create a community for those interested in statistics and analytics, as well as help those who are not already data-savvy gain quantitative skills. As statistics and analytics have become prevalent in more and more industries, HoyAlytics hopes to prepare MBAs for their careers.
“The club is on the cutting edge,” said Kenny Tan (MBA’19), one of the HoyAlytics founders. “Students are taking it in their own hands to make things happen.”
According to McDonough, the club recently held a free Excel workshop with nearly 40 full-time and Evening MBA students in attendance, and plans to continue holding workshops to teach different skills and software, such as Tableau, SAS, R, and SQL, as well as inviting guest speakers.
Student organizations and clubs generally provide great networking and professional benefits, such as access to industry leaders, professional development opportunities and the ability to make a real impact. A U.S. News & World Report list describes the following as reasons why it’s a good decision to get involved in a club in college:
- It allows students to become connected to their school
- It helps them build community
- It allows them to discover their passions and strengths
- It’s a résumé builder
- Sometimes, busier people do better
- Utilize your school’s resources
Check out some of the coolest MBA clubs and student organization’s in the Washington DC Metro here.
Georgetown McDonough MBA Career Center Releases 2017 Employment Stats

No surprise: Georgetown MBAs are making bank!
According to the most recent employment report from the Georgetown University McDonough School of Business, the average starting salary for graduates was $112,501, which is a 4 percent increase from the previous year.
“Every year, we deepen our commitment to applying a personalized approach to our students’ job searches, and every year, the results exceed our expectations,” Doreen Amorosa, associate dean and managing director of the MBA Career Center, said. “From the expanded and customized approaches to the job search in the MBA Career Center to curricular offerings like our Executive Challenge, our MBA students are prepared to excel in their careers.”
Additionally, the report stated that the average signing bonus of recent McDonough graduates were $28,516, a 13 percent increase from last year. Job offers accepted within three months of graduation also rose from 90 to 92 percent.
The report provide some addition, equally interesting information. For example, the top four industries of choice for Georgetown McDonough MBAs are financial services (33 percent), consulting (28 percent), technology (13 percent), and non-profit/social impact sector (7 percent).
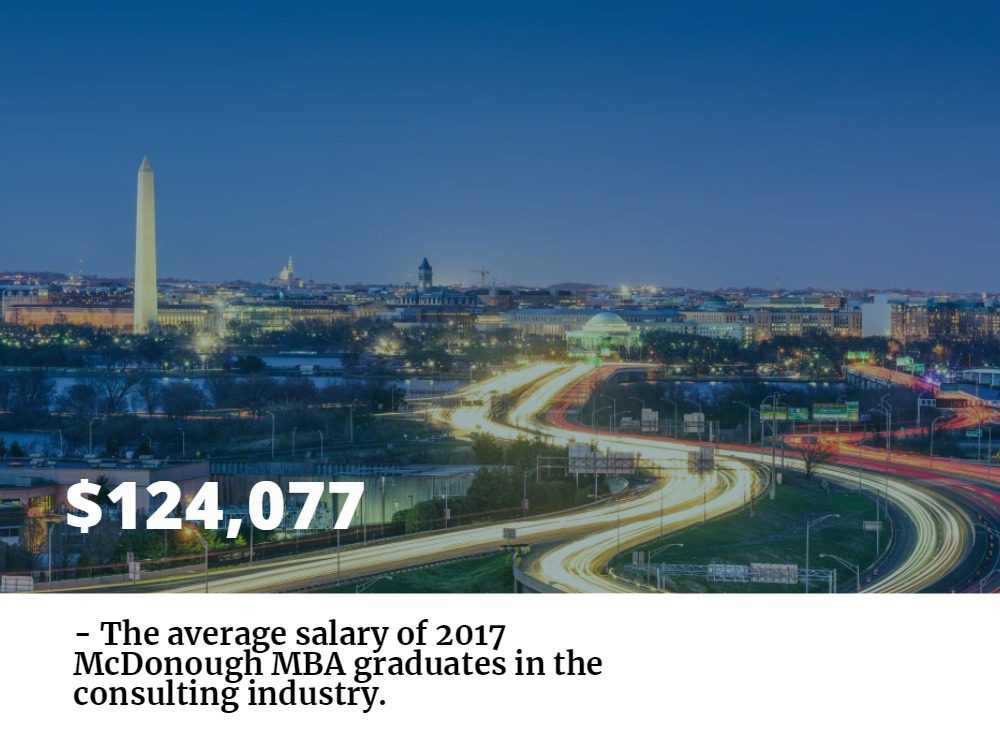
MBA graduates in the consulting industry are the highest earners among recent McDonough alums, pulling in over $124,000 annually, followed closely by those employed in the healthcare industry, which earned nearly $121,000 per year. In all, McDonough MBA grads included in the report earned lucrative positions at well-known companies, like Amazon, Bank of America, Barclays, Citi Group, Credit Suisse, Deloitte, EY, Google, PwC, and Verizon.
As far as internship data goes, 99 percent of first-year students secured an internship, with 85 percent of those paid positions. The average monthly compensation for internships was $6,501. Perhaps most impressive was that 81 percent of these internships were facilitated by the MBA Career Center, which is up 13 percent from 2016.
The Georgetown McDonough MBA Career Center is home to student organizations, Career Days and Treks, and on and off-campus networking events. The center partners with McDonough School of Business alumni to connect the future business leaders of America with today’s movers and shakers.
“We have invested in numerous strategic initiatives in recent years, including customizable search technologies, alumni mentoring tools, and offerings designed to individualize each student’s career outcomes,” Amorosa added in the press release. “Those, combined with our staff of certified career coaches and career curriculum that begins the summer before students arrive on campus, we equip our students with the strategies and experiences to be successful in their search.”
HBS Class of 2019 Profile Reveals Subtle Shifts, New GRE Details

The official Harvard Business School (HBS) Class of 2019 profile is now out—capturing in numbers and pie charts the real live students who started class for the first time yesterday. Not a lot has shifted since HBS released its preliminary class profile earlier this summer, although the Class of 2019 now includes 928 students, suggesting that 13 of those the school was expecting to enroll when it originally reported the class size at 941 made other plans. There are 942 students in the Class of 2018, by comparison.
The percentage of minority students also slipped slightly, from 26 percent reported in the preliminary profile to 25 percent in the actual class (last year’s actual percentage was 26 percent). Female students comprise 42 percent of the class, as earlier reported, again down one percentage point from last year.
In terms of median GMAT, 730 is still HBS’s reported score. That’s the same as last year—and as predicted earlier in the summer. The score range reported included a low of 580 and a high of 790, with the middle 80 percent of the class falling between 700 and 770. Last year, the middle 80 percent was a shade lower, coming in between 690 and 760.
HBS Joins Wharton, Yale in Posting GRE Scores
New in the actual profile posted today are stats on GRE scores, marking the first time HBS has published such data. Chad Losee, the Managing Director of Admissions and Financial Aid, also made a point of sharing this information in a recent blog post, revealing that 12 percent of the class submitted GRE scores and the remaining 88 percent submitted GMAT scores.
“The GRE and GMAT are different tests … and we are truly indifferent about which one you submit,” Losee writes. “Really. We are familiar with each test. Choose the one that allows you to best show your strengths, then move on to the other parts of the application.”
According to the recently posted profile, median GRE scores for both verbal and quantitative at HBS were 164. The score range for verbal was 147 to 170, and the range for quantitative was 151 to 170. HBS did not provide information about the average writing score.
The Wharton School, too, shared GRE data for the first time this year, although specific details about what percentage of the class opted for one test over the other were not made available. Wharton reported average scores, not median scores: 163 verbal, 162 quantitative, and a 4.7 average writing score. The Yale School of Management (SOM) also included GRE test scores in its Class of 2019 profile (median verbal, 166; median quantitative, 164; middle 80 percent verbal, 157 to 170; middle 80 percent quantitative, 160 to 169.)
If three makes a trend—then a trend we have of leading schools emphatically underscoring that they are indeed test agnostic by including GRE scores within their official class profiles.
“We Know You’re Much More Than a Test Score”
In his post, Losee also took pains to underscore that much more than scores go into determining who joins the HBS class each year.
“We know you are much more than a test score,” he writes. “The whole application and interview process are designed to help us get to know you. We’re trying to imagine what you would contribute in the HBS classroom and community. As I’ve written before, our learning model depends on a wide range of talent and perspectives in each class—and we know that not all that talent is measurable in a test.”
Obviously unchanged from the preliminary profile were the total number of applications HBS received this year—10,351—a 6 percent uptick over last year. The profiles posted today and earlier this summer both cited an 11 percent admission rate—which would indicate that 1,138 students made the cut—and a 91 percent yield.
This story has been edited and republished with permissions from Clear Admit.
What MBA Class of 2019 Profiles from HBS, Kellogg Reveal about YOUR Admission Chances

Northwestern’s Kellogg School of Management last week released a profile of its incoming Class of 2019, and Harvard Business School (HBS) earlier this summer released its own preliminary Class of 2019 profile. (The Boston school notes there could be subtle shifts come late August when the final class matriculates.) A look at both reveals that this past admissions cycle was a competitive one with few major shifts from the year before. It also shows some striking similarities between the incoming class compositions at the two schools.
Application Volume Increases
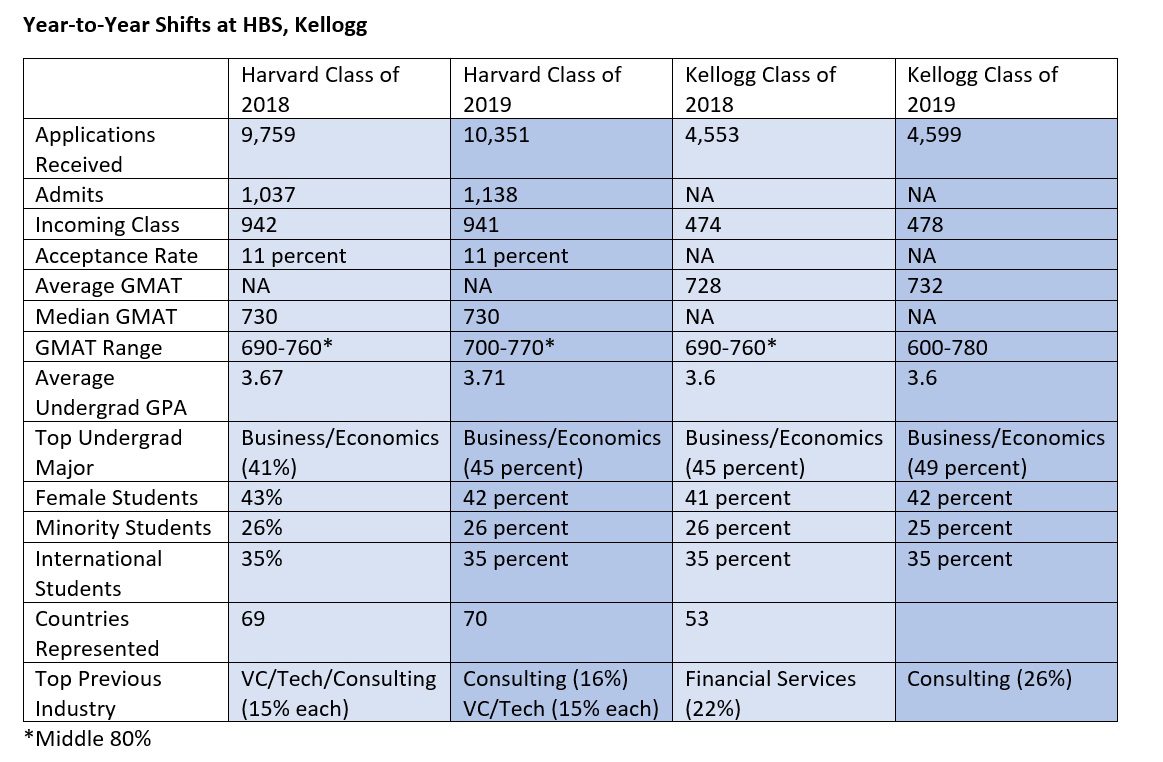
HBS clearly outperformed Kellogg in terms of application volume. At HBS, applications rose from 9,759 in 2015-2016 to 10,351 in 2016-2017, a 6 percent increase. The school maintained its stringent 11 percent acceptance rate, second only to Stanford’s, which has historically hovered around the 6-percent mark. Total enrollment this year is 941, down from 942 last year. According to the school, yield this year was 91 percent, which means more than nine of 10 accepted students decided to enroll.
At Kellogg, applications rose a more modest 1 percent over last year. Melissa Rapp, Kellogg Director of Admissions, characterized application volume as “steady” in an interview with Clear Admit earlier this summer. The single percentage point increase included slight upticks in domestic applicants as well as those from some international markets, which offset declines in applicants from other international markets, she says. Applications totaled 4,553 last year, which puts this year’s number closer to 4,600. Overall, 478 students comprise the incoming class, up from 474 in the Class of 2019.
Kellogg Continues Its GMAT Ascent
But where GMAT scores are concerned, Kellogg outshone HBS. HBS reported a median GMAT score of 730—identical to the two prior years. HBS does not share average GMAT score data, but it does reveal that the middle 80 percent of the class submitted scores between 700 and 770.
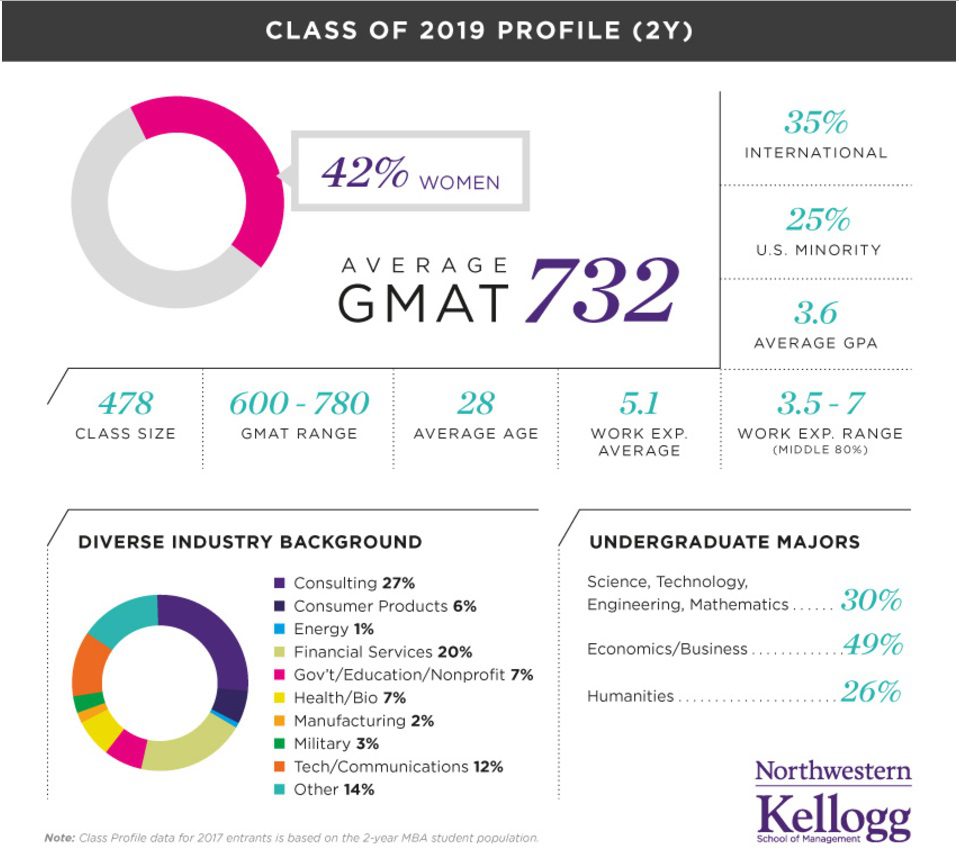
Kellogg, which shares average GMAT score, saw this metric rise another four points over last year, to 732. It’s the continuation of a multi-year increase for the Evanston school that just five years ago had an average GMAT score of 708. Its meteoric rise places it second only to Stanford Graduate School of Business where this metric is concerned, barring significant jumps at other schools that have not yet reported average scores for the incoming class. (Stanford GSB doesn’t release its incoming class profile until later in the fall, but last year’s average GMAT score was 737.) Kellogg’s overall GMAT score range was between 600 and 780. Last year, the range was 690 to 760—but last year’s data only reflects the middle 80 percent range, before Kellogg started reporting full range.
Undergraduate GPA, Major
In terms of average undergraduate GPA, HBS saw slight gains over last year, up to 3.71 from 3.67. At Kellogg, average GPA stayed the same as last year, at 3.6. As for what applicants studied while in college, both schools showed a greater preference for business backgrounds this year than last. At HBS, 45 percent of the incoming class majored in business or economics, up from 41 percent the year before. STEM majors were next, at 36 percent, with humanities majors bringing up the rear at just 19 percent. (Last year, STEM majors accounted for 38 percent, humanities majors, 21 percent.) At Kellogg, 49 percent of this year’s incoming class majored in business or economics, up from 45 percent of the previous class. STEM majors, meanwhile, made up 30 percent (up from 29 percent the year before), and humanities majors rounded out the class, at 26 percent (compared to 28 percent last year).
Class Diversity Similar at Both Schools
In terms of class diversity, both Kellogg and HBS will welcome incoming classes that are 42 percent women, down slightly from 43 percent at HBS and up slightly from 41 percent at Kellogg. Forty-three percent has thus far proven the high-water mark at both institutions.
At HBS, 35 percent of the class is international, and 26 percent belongs to U.S. ethnic minorities—mirroring last year’s stats. Kellogg’s incoming class is also 35 percent international, though U.S. minorities are 25 percent, a percentage point decline since last year. Still, Kellogg notes that this year’s class is among the school’s most diverse ever.
At HBS, the incoming class counts students from 70 countries, though 69 percent of students are from North America and 65 percent are from the United States. Students from Asia make up 14 percent of the class, with Europeans comprising another 10 percent. Student from Central and South America make up another 4 percent of the class, and 2 percent—or 16 students—hail from Africa.
Varied Professional Experience
Both schools tout the varied professional experience represented by the incoming class. At HBS, those from a consulting background make up 16 percent of the class, followed closely by venture capital and private equity, which each comprise another 15 percent. The financial services category makes up 11 percent, followed by government/education/nonprofit, healthcare/biotech, and other services (each at 7 percent); consumer products and energy (6 percent each), and finally manufacturing and military (each at 5 percent). HBS shared that the average age of those in the incoming class is 27, though no details about average years of work experience were made available.
HBS Touts Its Diversity in Video Entitled “Mosaic of Perspectives”
Kellogg, meanwhile, shows a greater predilection toward applicants from a consulting background, who make up 27 percent of this year’s incoming class. Applicants who have worked in financial services follow, at 20 percent; “other” makes up 14 percent, and those from a tech/communications background make up 12 percent. Other less represented backgrounds include government/education/nonprofit and healthcare/bio (each 7 percent), consumer products (6 percent), military (3 percent), manufacturing (2 percent), and energy (1 percent). Average work experience at Kellogg this year is 5.1 years, with 80 percent of the class having between 3.5 and 7 years. The average age of the incoming class is 28.
Rapp expressed great enthusiasm about both the diversity and high quality of the group of students who are just now arriving on campus, noting that theirs will be the first class that will get to enjoy Kellogg’s gorgeous new Global Hub for their entire time in business school. “As we do every year, we looked for leaders that are focused on collaborating to create impact and lasting value wherever they go—before Kellogg, during their time at Kellogg, and in the future,” she said. “Our comprehensive approach to admissions enables us to attract an incredibly well-rounded group of students to Kellogg. The quality of the applicant pool has increased this year, and the quality of our accepted students is commensurate with that.”
Chad Losee, HBS managing director of MBA admissions and financial aid, shared fewer words but no less enthusiasm. “So hard to capture the talent and diversity of perspectives in this group. They are amazing!” he wrote on his Director’s Blog.
This article has been edited and republished with permissions from Clear Admit.
A Look Inside McCombs Latest MBA Employment Report

Many students pursue an MBA with one goal—to improve their career opportunities. Whether you’re leveraging an MBA to transition into a different industry or to move up within your current company, it’s important to get a return on your academic investment. So, how do you know if a particular MBA program is going to advance your progress toward your career goals? Reviewing a school’s MBA employment report is one of the best ways to assess a school’s potential to get you where you want to be.
Every year, MBA programs carefully track where their graduates head after earning their MBAs. These stats, which include salary details, top hiring firms and popular industries and job functions, provide a detailed overview of the job outcomes of their most recent MBA graduates. If reviewed carefully, these reports can give you a good sense of how well a particular MBA program will be in helping you land your dream job.
Recently, the McCombs School of Business released its 2016 Full-Time MBA Employment Statistics. We spoke to Stacey Rudnick, the Director of MBA Career Management at McCombs, to get her perspective on which statistics are most important for prospective students to consider and what trends stood out this past year. Continue reading…
UIC School of Business IDS Seminar Series With Matthew Taddy

On Friday, December 4 from 1:45PM – 3:45PM, Matthew Taddy, an associate professor of Econometrics and Statistics at Chicago Booth, will speak at the UIC School of Business. Taddy’s appearance comes as part of the school’s Information and Decision Sciences (IDS) Seminar Series, where each week, IDS faculty from across the nation bring their latest research to faculty, staff and students. Continue reading…
